Logging data with DevoVision App
DevoVision is a way to display your Filament Maker data directly in a graph in real time, and then save the graphs for future analysis. You’re able to customize your own graphs, and that will help you understand extrusion experiments, find better settings, and quality check your spools.
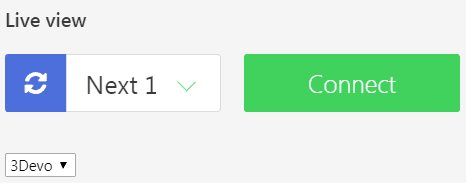
How to start using DevoVision App:
Step 1: Download DevoVision App here:
https://3devo.com/devovision/download/
Step 2: Locate the downloaded file on your computer and double click to start the installation
Step 3: Install the program according the instructions on the prompt.
Step 4: Read the End-User agreement press “agree” if you want to use the program
DevoVision App has now been installed and is ready for its first use
If you encounter any problems or have some feedback, please use this link:
Introduction
The DevoVision App has seven navigation tabs on the left side which are
- Live view
- Log view
- Workspace
- Charts
- Settings
- Provide feedback
- Logout
These navigation tabs will be explained below
Starting your first log
Step 1: Go to the “Live view” tab
Step 2: Turn on the power of the Filament Maker.
Step 3: Connect the Filament Maker with the USB cable to a computer
Step 4: Open the downloaded DevoVision App
Step 5: Select the Filament Maker and press connect. If you’ve plugged in a Filament Maker after this step then you can use the blue refresh button to detect this machine.
Step 6: Follow the instructions on the prompt.
Note: The small button which is labelled “3Devo” is a workspace. An introduction to workspaces will be discussed later in this manual.
Step 7: Press “Start logging”
Your log has now been started
Adding a new workspace
Step 1: Go to the “Workspace” tab
Step 2: Press the green “+ “ icon. This will add a new workspace called “new”
Step 3: Select the new workspace, enter a custom name and press update. This will update the new workspace with your chosen name.
Your new workspace is now ready to use.
Adding and customizing charts
Step 1: Go to the “Charts” tab
Step 2: Press “add new”
Step 3: Name your new chart
Step 4: Modify “Axes”
Your screen will look like this:
Press the “yaxis” to modify this axis.
Rename the title to give your Y-axis a name.
Change the ‘min range:’ to add a minimal value for your Y-axis
Change the ‘max range:’ to add a maximum value for your Y-axis
If you leave these blank the graph will auto-adjust to scale to the minium and maximum range of the data.
Press “Add right axis” to add a second Y-axis on the right side.
Step 5: Modify “Traces”
You can rename the plot and give it a custom colour.
Select a datapoint you’d like to plot.
Press “Add Trace” to add a new trace
Step 6: Add horizontal or vertical rulers
You can rename the rulers and give them a custom colour.
For the position you have to enter the X coordinates for the vertical ruler and the Y coordinates for the horizontal ruler.
Step 7: Press the green “Save as new” button on the bottom of the page.
Your new chart has now been saved
Changing the program settings
There are 2 settings that you can modify:
- Enable anonymous data tracking
- Run application on public network
The first setting will allow 3devo to gather anonymous data statistics which will help us improve the app. The other option will let you acces the active DevoVision app though another computer on the same network.
The red “restart” button will restart the application.
Default log location
Where your logs are saved, depends on the operating system you’re using. The default locations are:
Windows: ~AppDataLocal3Devo
Linux: ~.local3Devo
Mac: ~application3Devo