
Charts display the data captured by DevoVision configured to your liking. The charts can be simply re-arranged to have the preferred charts per sheet and workspace. However, if you're looking for specific tolerances, indicators or combined data to review, a custom chart can offer the solution.
Create new charts
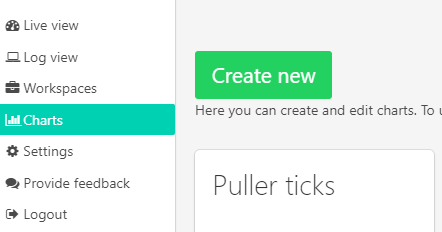
- Navigate to the "Charts" tab in the main menu.
- Click "Create new"
- Adjust the properties of your chart on the right side, see details in the next chapter.
 |
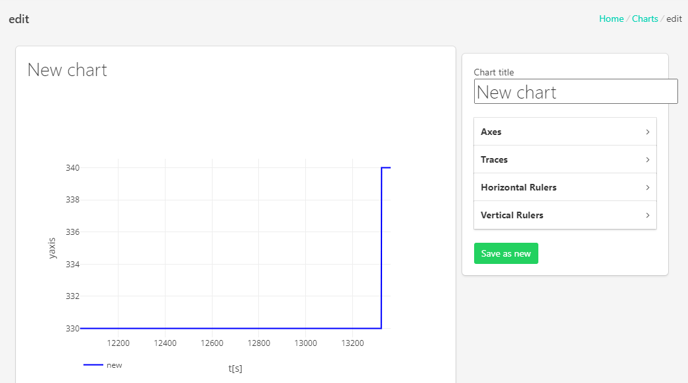 |
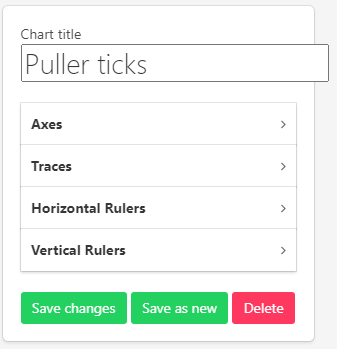
Chart title
Choose a fitting title for your chart data.
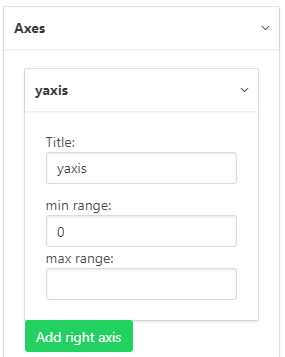
Axes
Traces
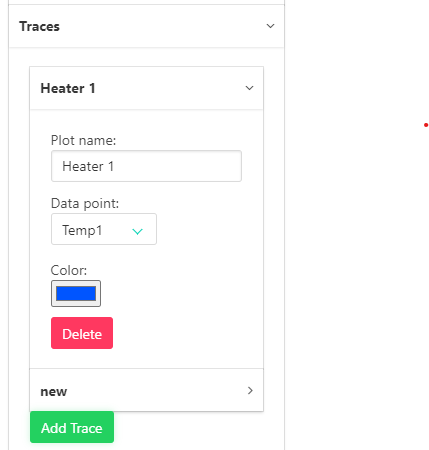
Data points
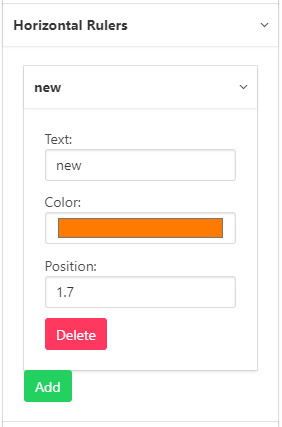
Horizontal and vertical Rulers
Example chart
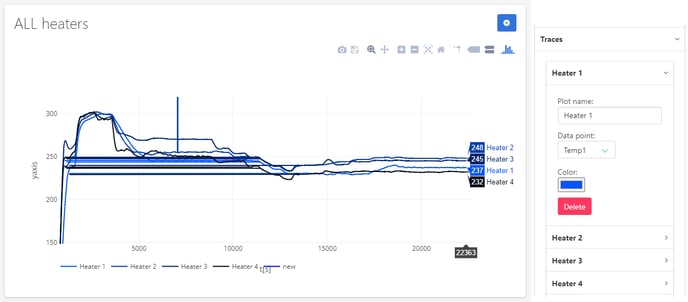
In this example chart, all heater temperature data ("Temp 1, 2,3 and 4") is captured in 4 traces, plotted in the same chart.
Edit charts
|
If you wish to make changes to existing charts:
|
 |
Note
We advice to always "Save as new" to ensure the default 3devo charts are not altered in a negative way.
Continue reading
The "Settings" are used to change the privacy and network preferences for DevoVision.