Workspaces: How to customize DevoVision
DevoVision workspaces allow to customize the data visualization while logging, which can be completely customized to your liking.
Workspaces are a great way to display the recorded data in the way you prefer. The workspace defines what live data you have available and what tabs contain the charts. You can move charts around, change default axes and table settings to suit your needs.
Create a new workspace
- Navigate to the "Workspaces" tab in the main menu to get started.
NOTE: By default, the "3devo" workspace is active. You may make adjustments, but it's advised to start your workspace from scratch. - Click "Create new workspace", and rename it by changing the "Workspace title".
- Ensure to click "Save Changes" save your workspace.

Load and apply your workspace
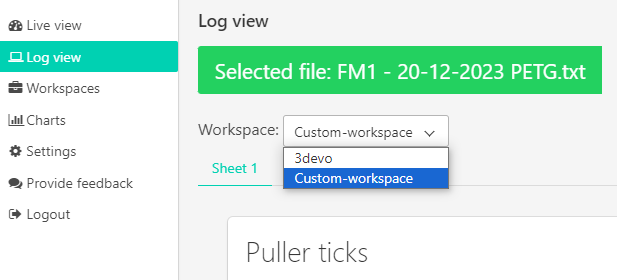
Custom workspaces can be used in the "Live view" when logging data, or in the "Log view" with previously recorded data.
- Go to the "Live view" or "Log view".
- Click "Workspace" and select your custom workspace.

Add or change Sheets
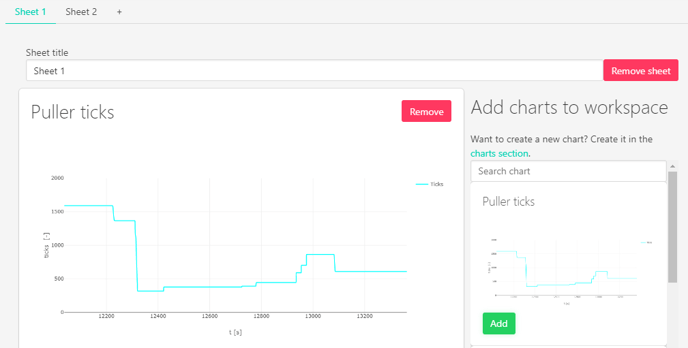
- Sheets can be added by clicking the "+" icon.
- Rename the sheet to represent what data is reflected.
- Sheets can be removed with the "Remove sheet" button, while the sheet is active.
- Ensure to click "Save changes" to save your workspace.

Add default Charts
DevoVision offers default charts to help you get started with your workspace. These default charts are also visible while using the default "3devo workspace".
- To add a chart, ensure the correct "Sheet" is selected.
- Scroll down and find a chart on the right side.
- Click "Add" to add the chart to the sheet, it will show on the left side immediately.
- Ensure to click "Save changes" to save your workspace.

Add custom Charts
Creating your own charts can greatly benefit you to read recorded data more easily and achieve specific results. Continue reading the next article, about custom charts.
Continue reading
The "Charts" are used to customize charts for Workspaces in DevoVision.
